Reports Panel
Vantage includes a dedicated reporting centre where you will find reports on all aspects of your data. It is indicated on the toolbar by this bar chart icon:
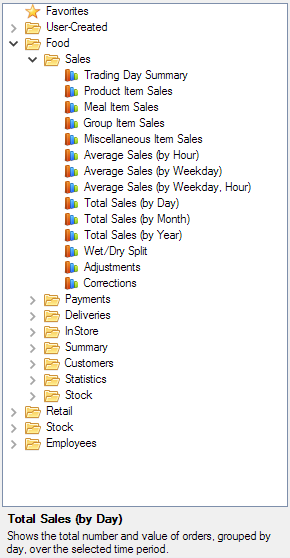
When you first view the reports panel, you will see a large empty space in the centre and a list of report categories on the left hand side:
Running Reports
Explore the categories on the left to find the reports that you need. Some reports fall into multiple categories.
To open a report, double-click it with the mouse, or highlight it and either press enter on the keyboard or click 'Open' in the toolbar above.
The selected report will then open up in the empty area, and begin running. Some reports will run very quickly and some will take longer; a loading animation is shown whilst a report is running, but you can continue to use Vantage, including opening other reports, whilst it is running.
As an example for this tutorial, we'll load the report for showing monthly food sales, which can be found here:
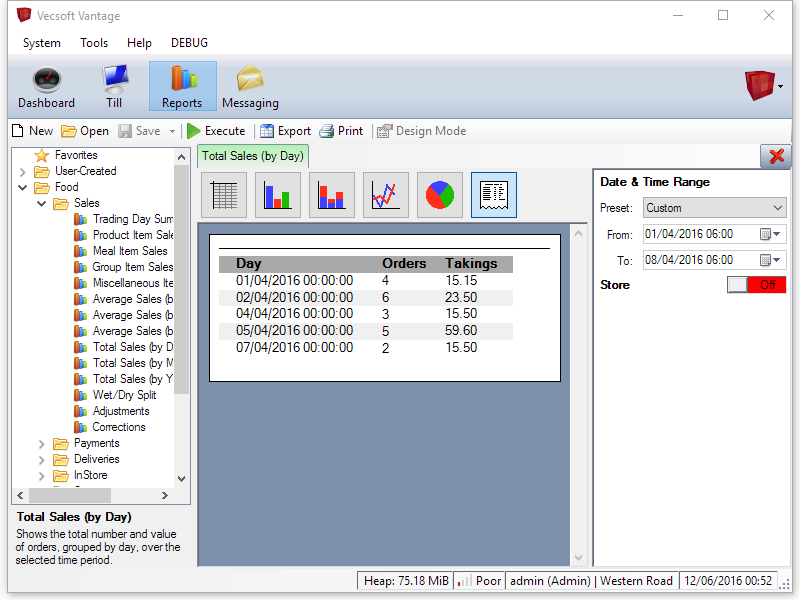
When a report completes, the large central area will display the results. By default, most reports will start by showing tabular data in a grid format, similar to a spreadsheet:
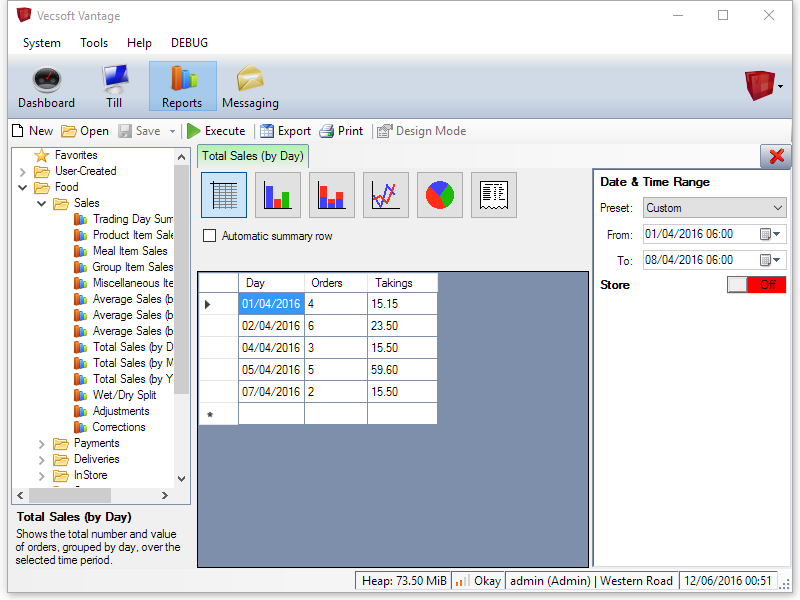
You can get add an automatically generated totals line to this grid by checking the 'Automatic summary row' checkbox.
Customising Reports
You can customise the data that reports return using the controls on the right hand side. Every report has different options, but they are all set in the same place.
Almost all reports let you specify a date and time range, with a panel that looks like this:
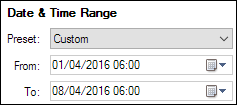
There are a number of useful presets available from the 'Preset' dropdown, or you can select 'Custom' from the dropdown and then choose any date range using the start and end pickers below.
Important note: the time is important as well as the date, so it's important to make sure that the start and end times include the period you want to see.
Other customisation options can be switched on and off. In the current example, there is an option to filter the results to a particluar store, but it is switched off:
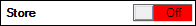
To enable store filtering, click the red 'Off' switch. It will change to say 'On' and become green, and the store filtering option will be displayed:
We can now selected a store to filter by from the 'Store' drop down, but the report results will not change immediately. To update the report results with the new customisation options, press the 'Execute' button in the toolbar or press the F5 key on the keyboard.

The results area will then update. To turn off the customisation option again, just click the 'On' switch to toggle it back to the 'Off' position.
Graphs & Charts
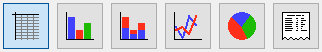
Most reports can also be viewed in a number of other ways, including various graph types and a printable report document. Click the various view icons to change the view:
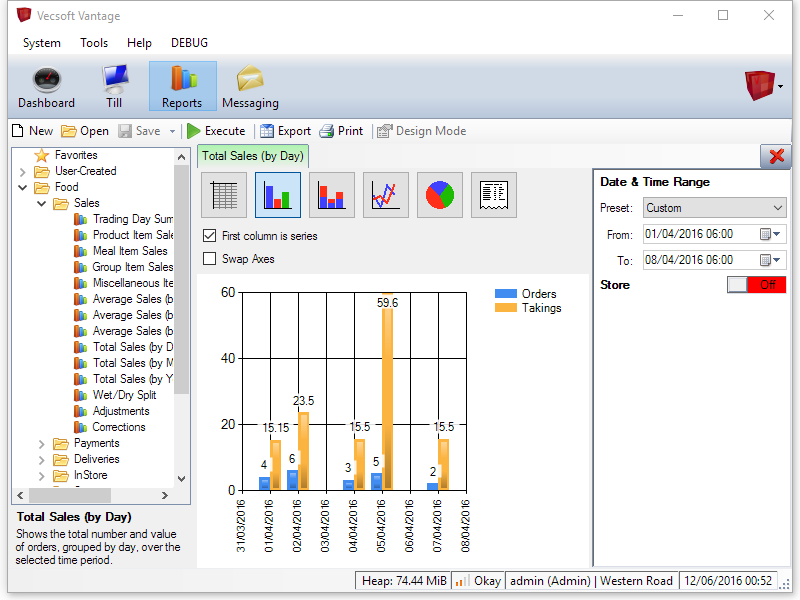
Here is the same data as a bar chart:
and as report document:
Exporting Data
To keep permanent copies of your report results, you can export them to files or print them. There are two buttons on the toolbar for this:
The 'Export' button will save the current results to a file. The type of file depends on the type of results view that is active; the grid view will save to a CSV file that can be opened in other software such as Microsoft Excel, graph views will save as an image, and document views can be saved as a PDF document.
The output of the 'Print' button also depends on the current view. You will get a preview of the output and a chance to customise the page layout before printing begins.